Guides › Wellbeing surveys
Wellbeing surveys
How to answer a wellbeing survey, read the results and build your own surveys – from the weekly pulse to the annual wellbeing survey.
What the module does
Wellbeing surveys – Wellbeing in the menu – are short, anonymous questionnaires about how employees are doing at work. The results show an overall score, themes and the development from round to round.
- Answer – the surveys waiting for you.
- Results – for those who may see them (HR, administrators and the leaders of departments).
- Manage surveys – build, start and close surveys.
The module is off until an administrator turns it on.
Answer a survey
- Choose Wellbeing in the menu. The number next to the menu item shows how many surveys are waiting for you.
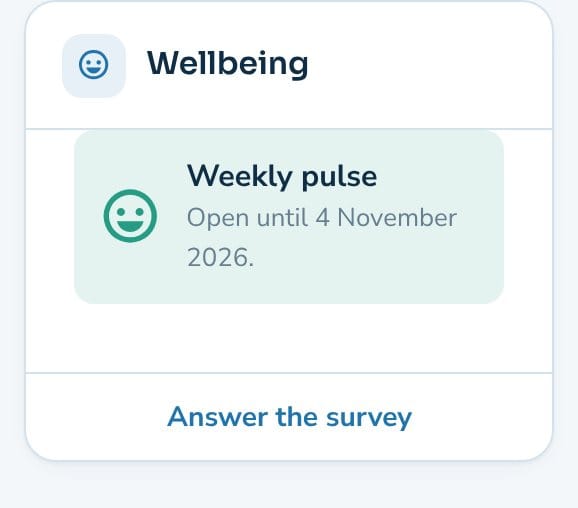
- Click Answer the survey on the card. The card shows how many questions there are and when the survey closes (“Open until …”).
- Answer the questions. Questions marked * must be answered.
- Click Send my answers. You see “Thank you for your answers”, and the survey disappears from the list.
You can only answer once per round. You get a notification when a new round opens, and one reminder the day before it closes if you haven’t answered.
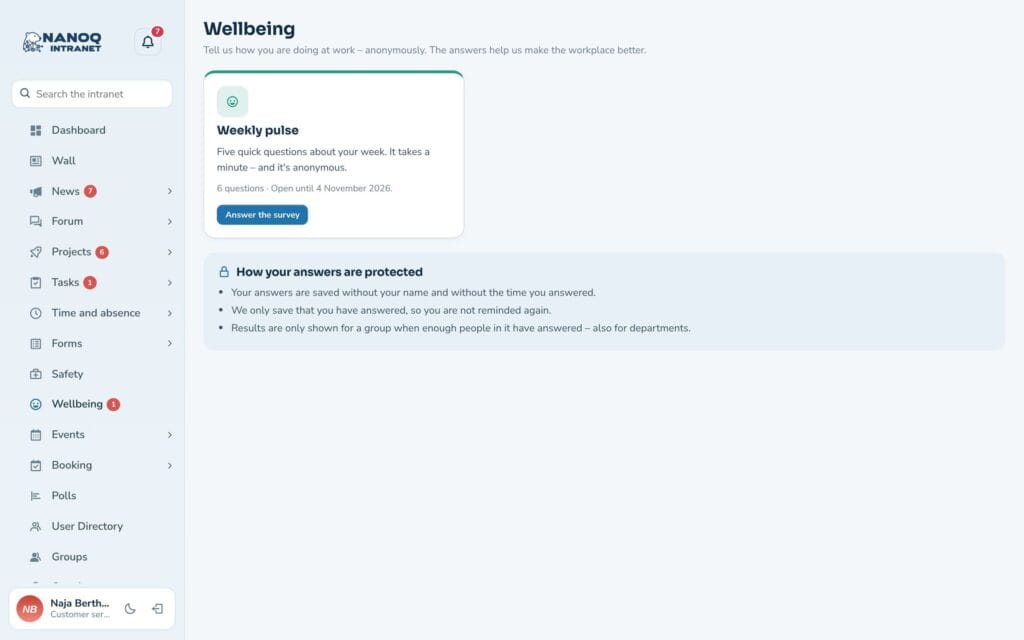
The question types
- Agree – disagree (1–5) – from Strongly disagree to Strongly agree.
- Mood (5 faces) – from Very bad to Very good.
- Recommend the workplace (0–10, eNPS) – from Not at all likely to Extremely likely.
- Yes or no and one choice.
- Comment (free text) – optional unless it is marked with *.
Don’t know and follow-up questions
Questions can have the answer Don’t know (but not eNPS). “Don’t know” isn’t counted in the result, but the number is shown.
A follow-up question is only shown to those who answered in a certain way – for example “What was it about?” for those who answered yes. Choose Follow-up: only ask when … on the question. The result is only shown when enough people have answered the follow-up.
Save good questions with the bookmark button, and fetch them again with Add from the question bank – together with the questions from the templates.
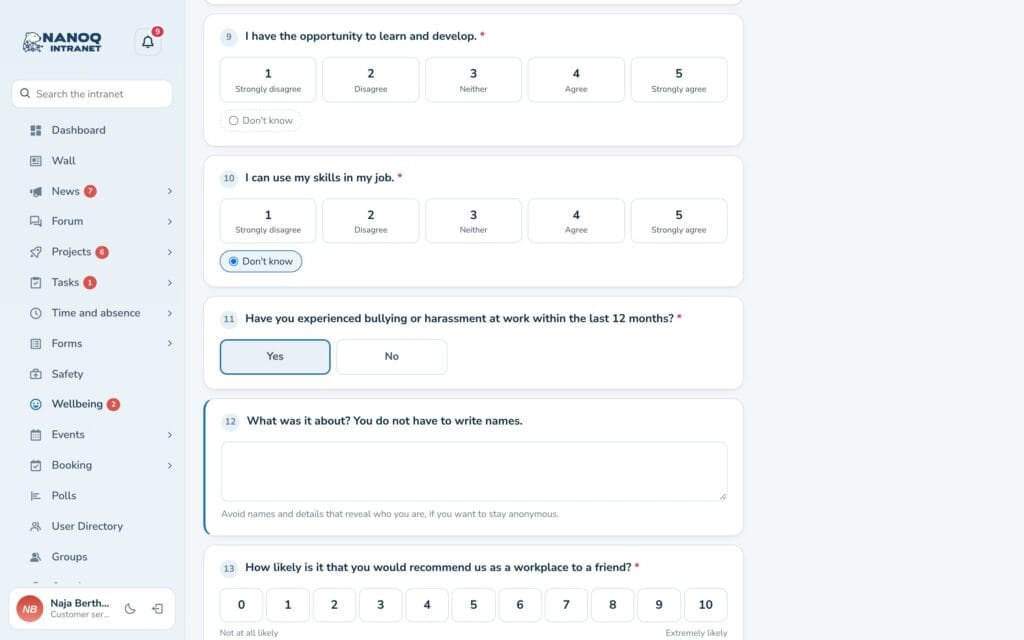
On the phone
The answer form has large buttons and faces, so it’s easy to answer on the phone – also in dark mode. If you have added Nanoq to your home screen and turned on push, you are notified when a survey opens.
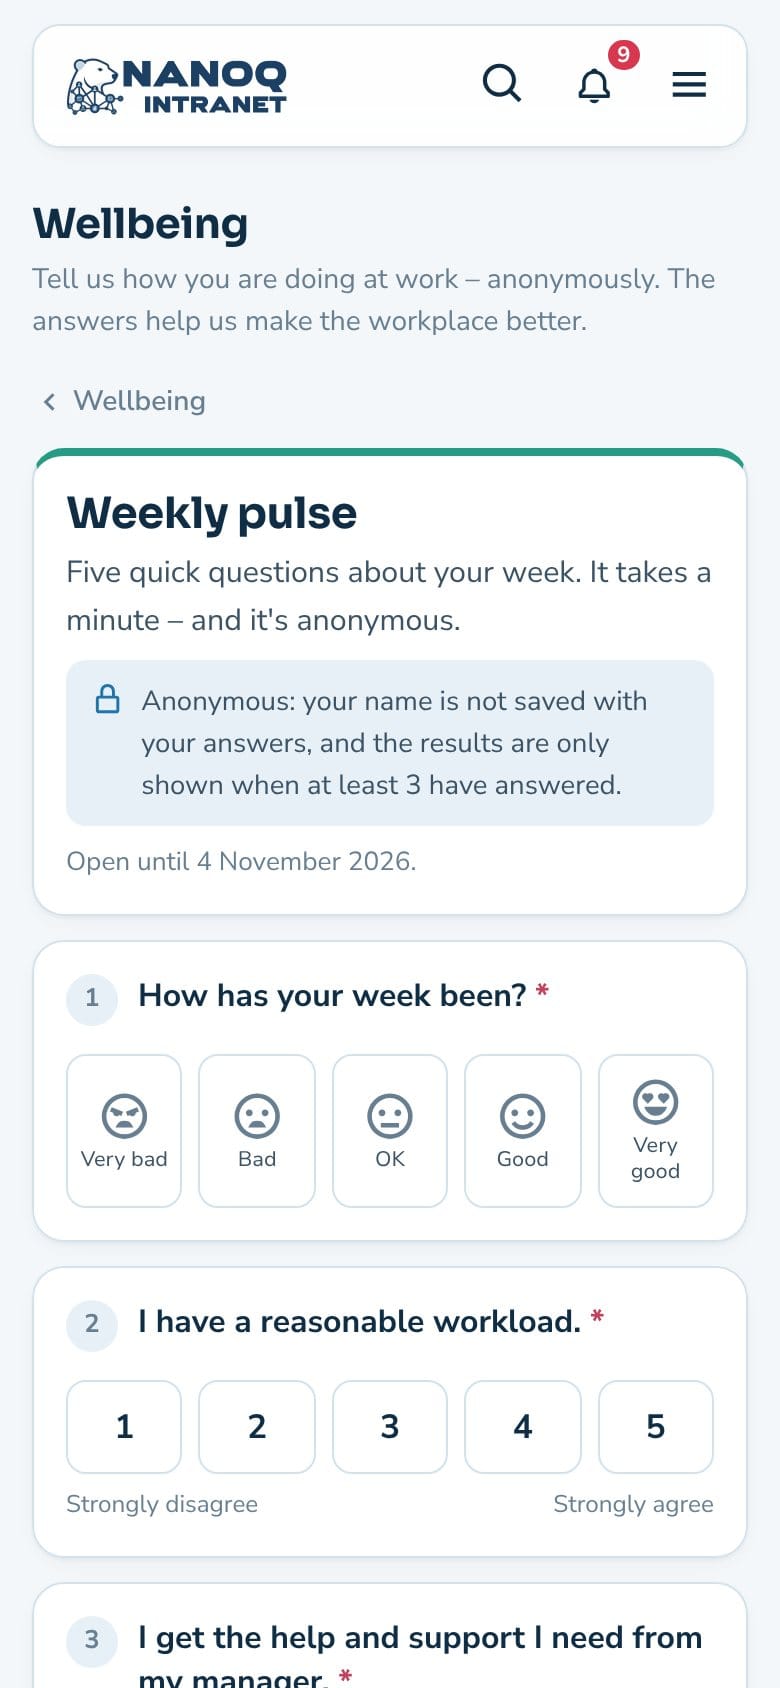
How your answers are protected
- Your answers are stored without your name and without the time you answered.
- Nanoq only stores that you have answered, so you don’t answer twice and aren’t reminded again.
- Results are only shown when enough people have answered – also for each department. The limit is 5 answers by default.
- Comments are shown in random order and only to HR and administrators. Don’t write anything that reveals who you are if you want to stay anonymous.
- Nobody can see your individual answers – not even an administrator. The Excel file only contains the combined figures.
Results
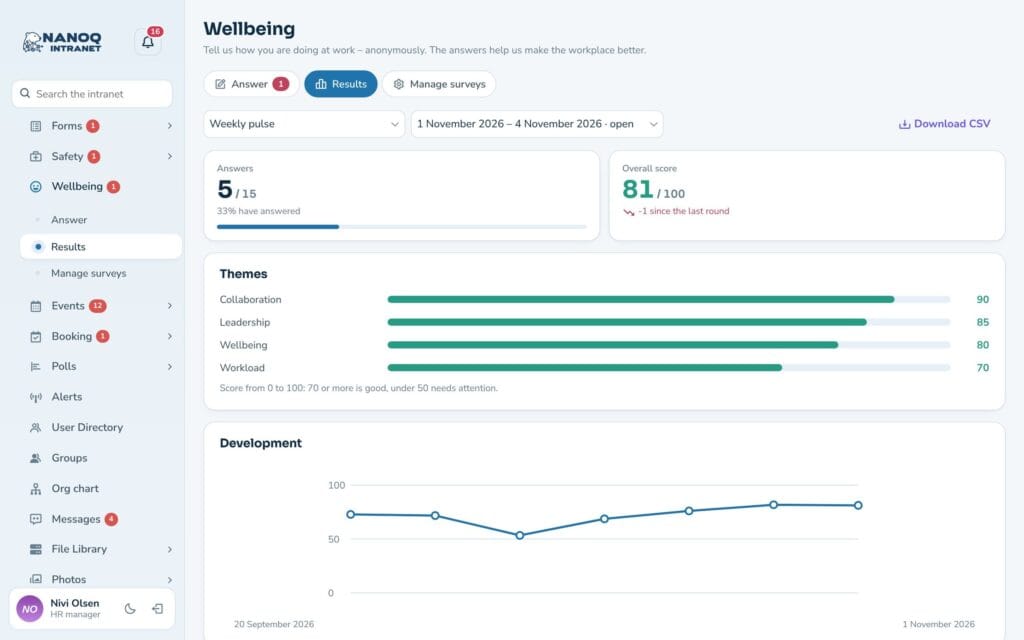
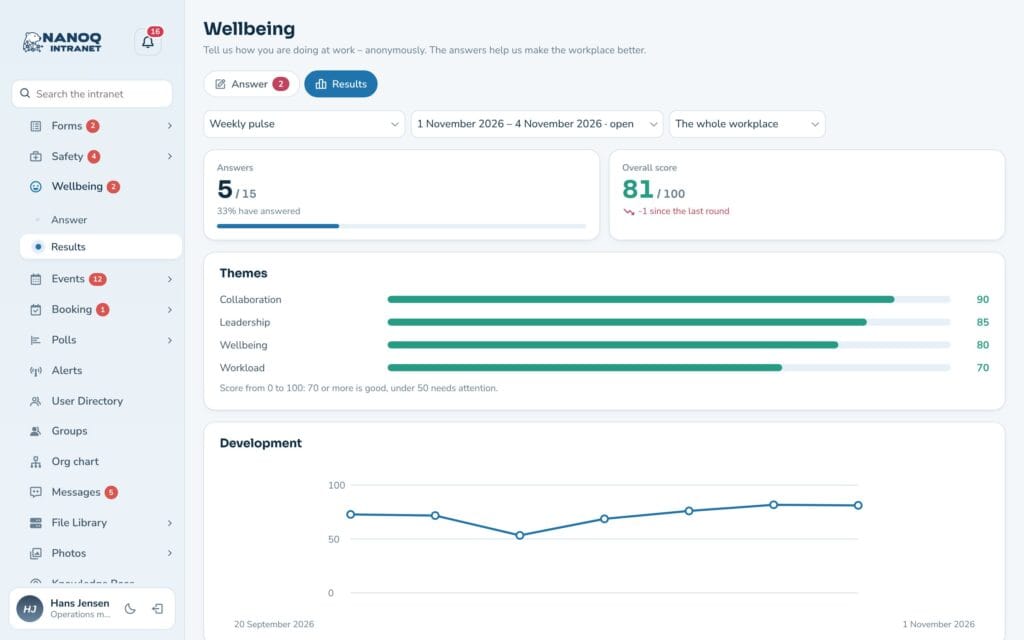
Choose Results. At the top you choose the survey, round and department (“The whole workplace” or a department).
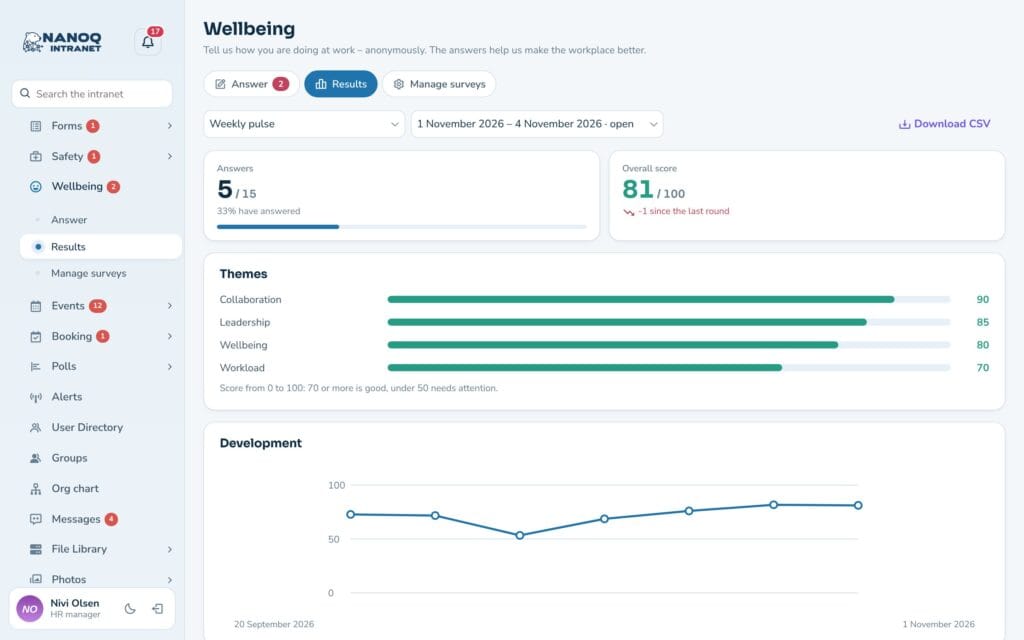
- Replies – how many have answered, and what percentage that is.
- Overall score – from 0 to 100 with the change since the last round. 70 or more is good; below 50 needs attention.
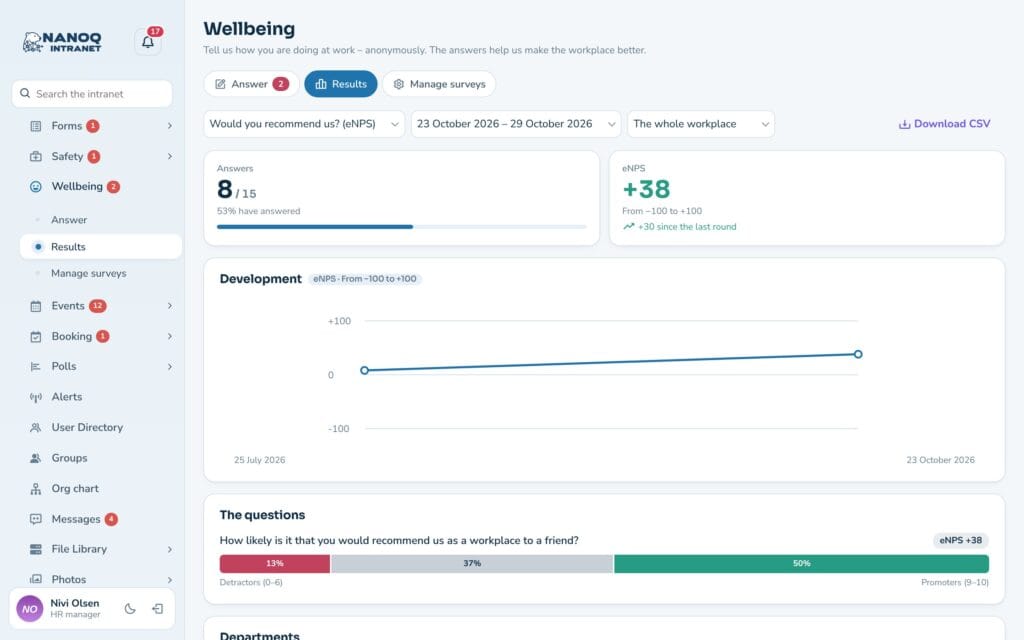
- eNPS – from −100 to +100: promoters (9–10) minus detractors (0–6).
- Themes – for example wellbeing, workload, leadership and collaboration.
- Development – the overall score for each round as a graph. If the survey only has eNPS (e.g. “Would you recommend us?”), the graph shows eNPS from −100 to +100, and the eNPS card shows the change since the last round.
- The questions – the distribution and average for each question. Negative statements (e.g. “I often feel stressed”) are reversed, so a high score is always good.
- Departments – departments with fewer answers than the limit are hidden.
- Comments and Download CSV (the combined figures for Excel).
The results are shown when the round is closed – not while it is open, so no one can see how the result changes when a particular person answers (from version 1.56). The limit on the number of answers stays as it was when the round started. If the rest of the workplace has so few answers that a department could be worked out by comparing with the whole workplace, the department is not shown on its own in that round.
The departments over time
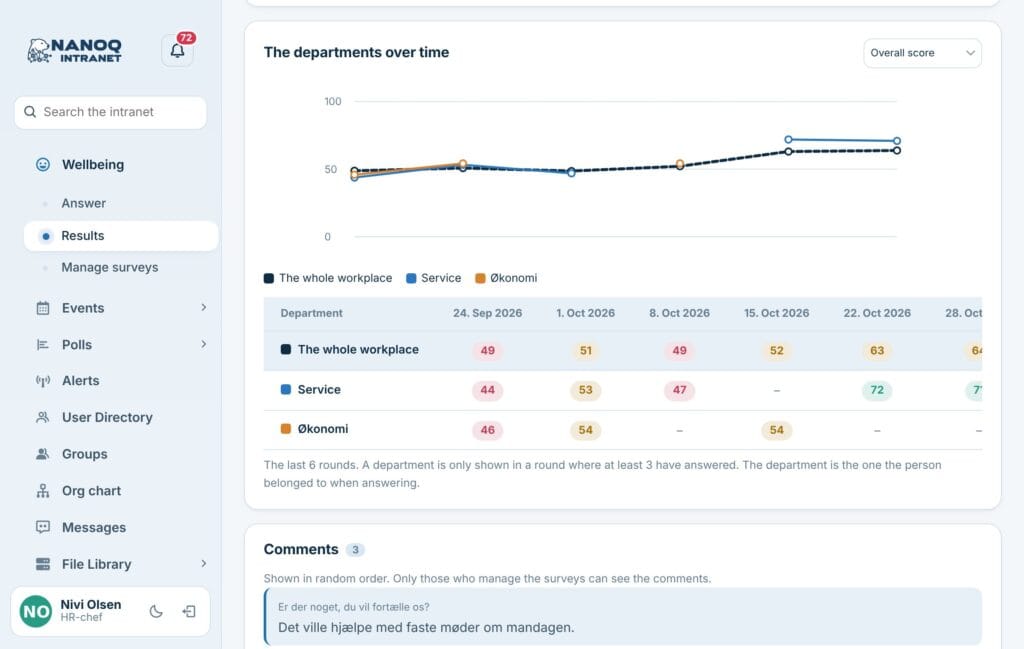
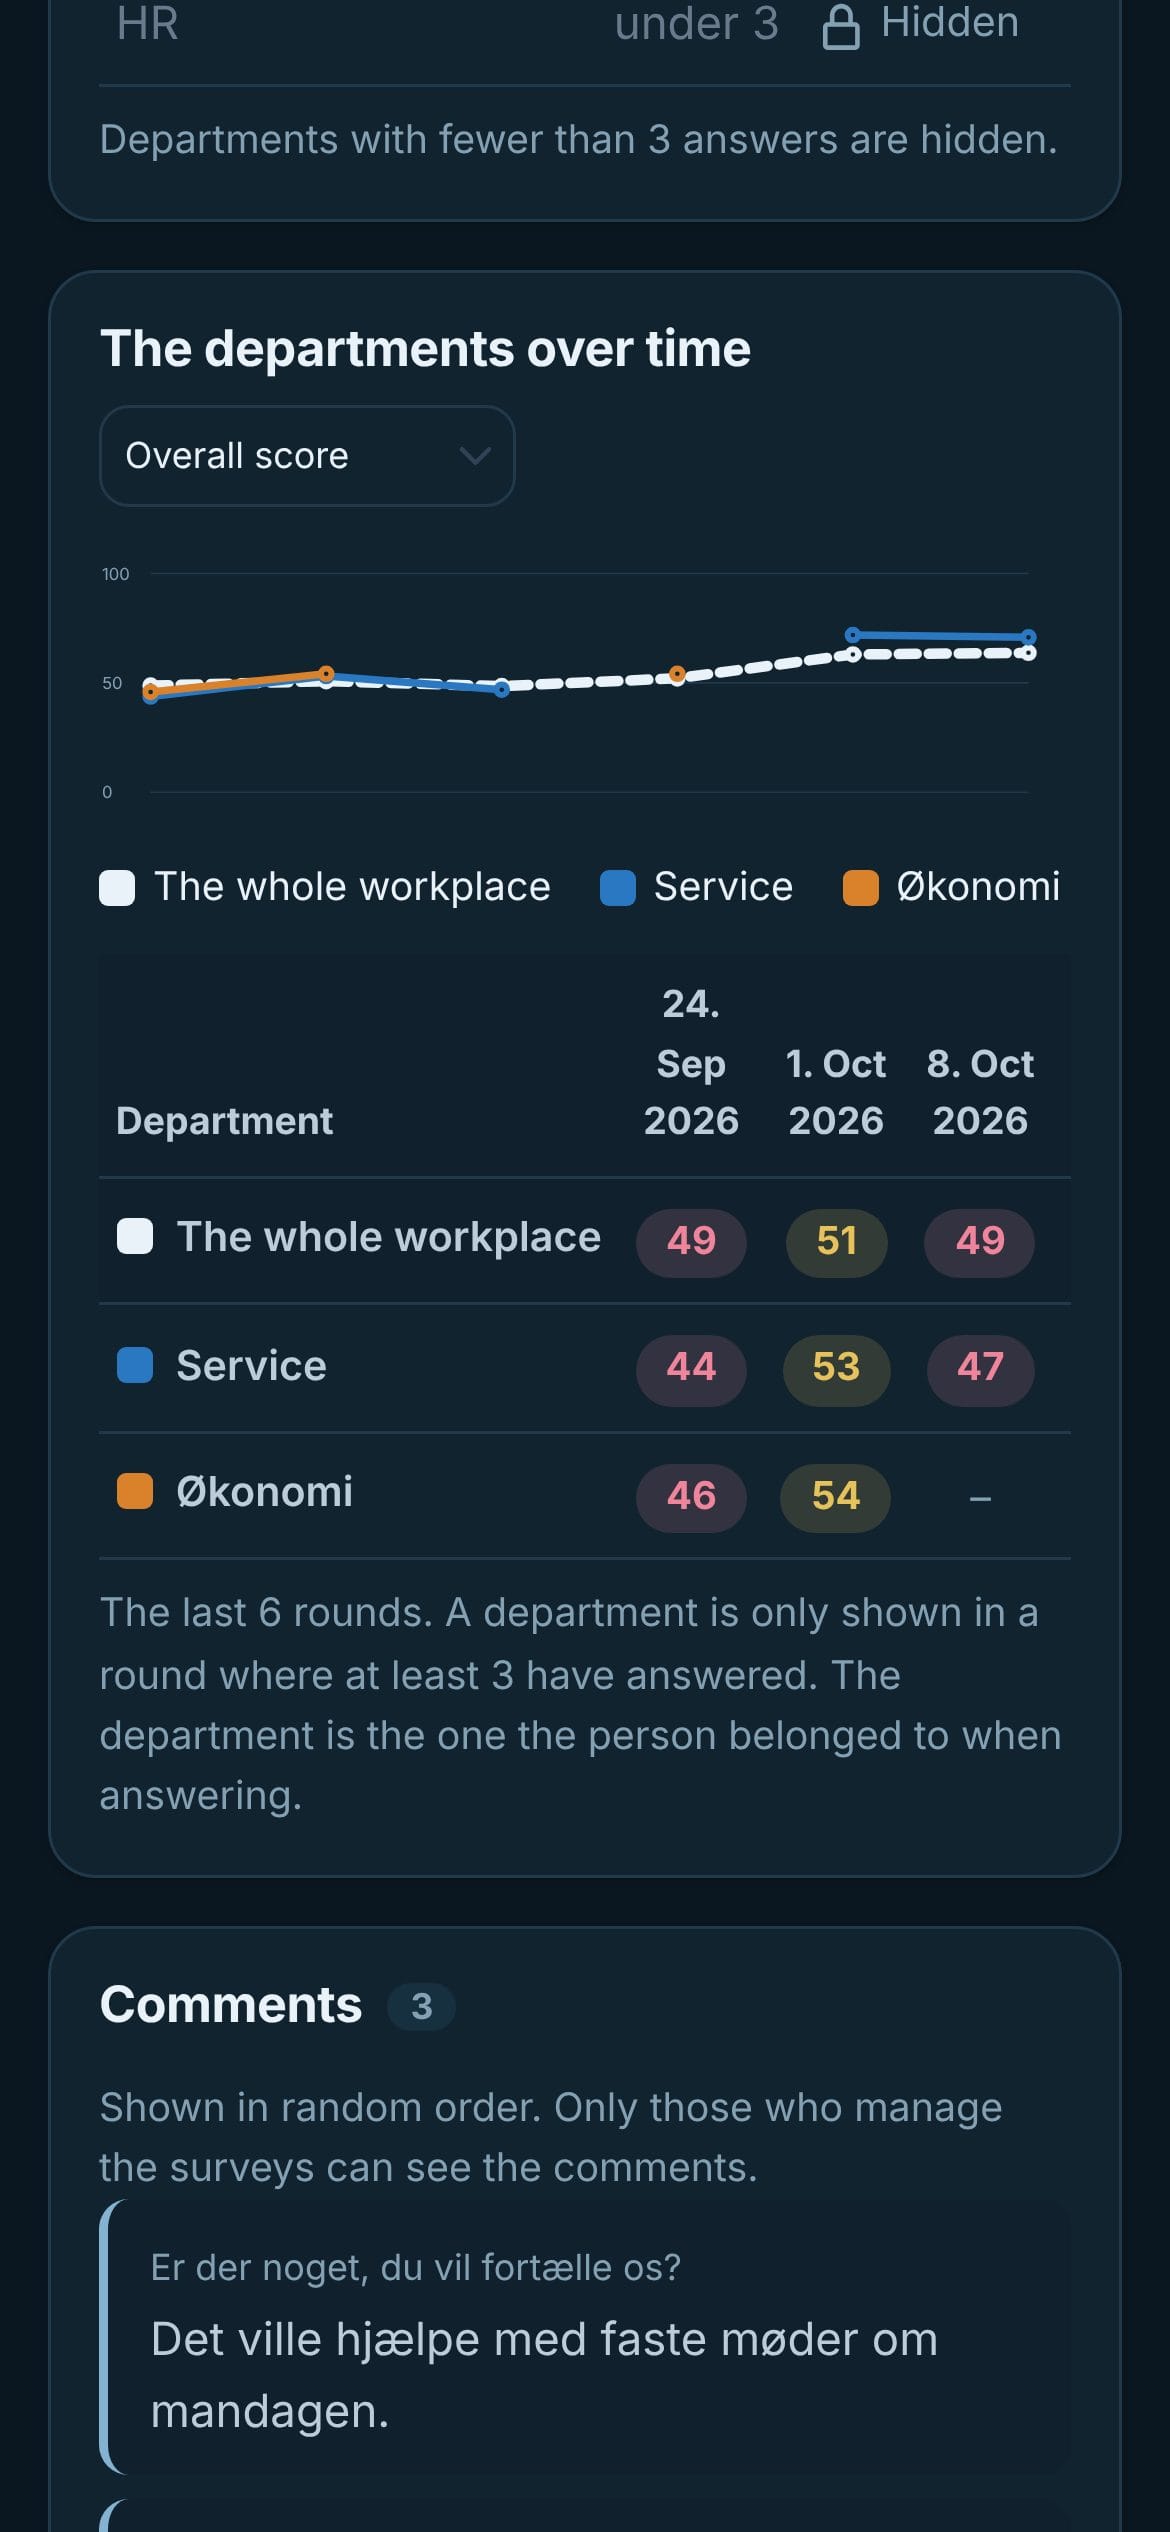
Under the results, The departments over time is shown when the survey has at least two rounds: a chart with one line per department (the whole workplace dashed) and a table of the latest rounds with the change. Choose whether to compare the overall score, eNPS or a theme.
A department is only shown in rounds where enough people have answered – otherwise it shows “–”. Administrators and HR see all departments, leaders their own.
For managers
If you are the leader of a Nanoq group, you see the result for the whole workplace and for your own department – when enough people in the department have answered. You don’t see other departments or the comments. The department comes from the org chart (otherwise your first group). Under The departments over time you see your department alongside the whole workplace.
Create and edit a survey
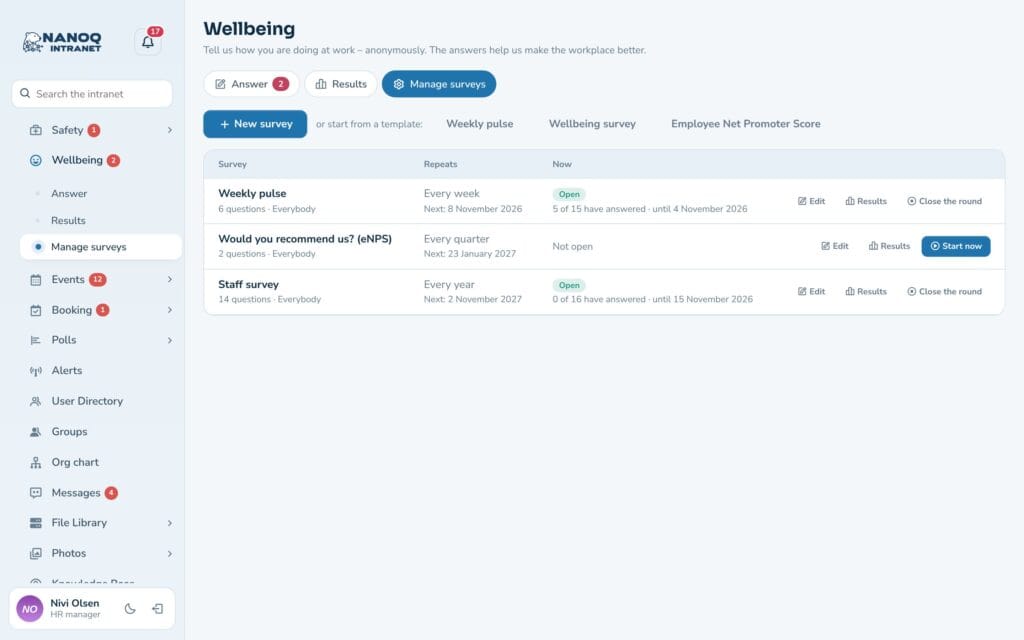
- Choose Wellbeing → Manage surveys.
- Click New survey, or start from a template: Weekly pulse (5 questions), Wellbeing survey (13 questions) or Employee Net Promoter Score.
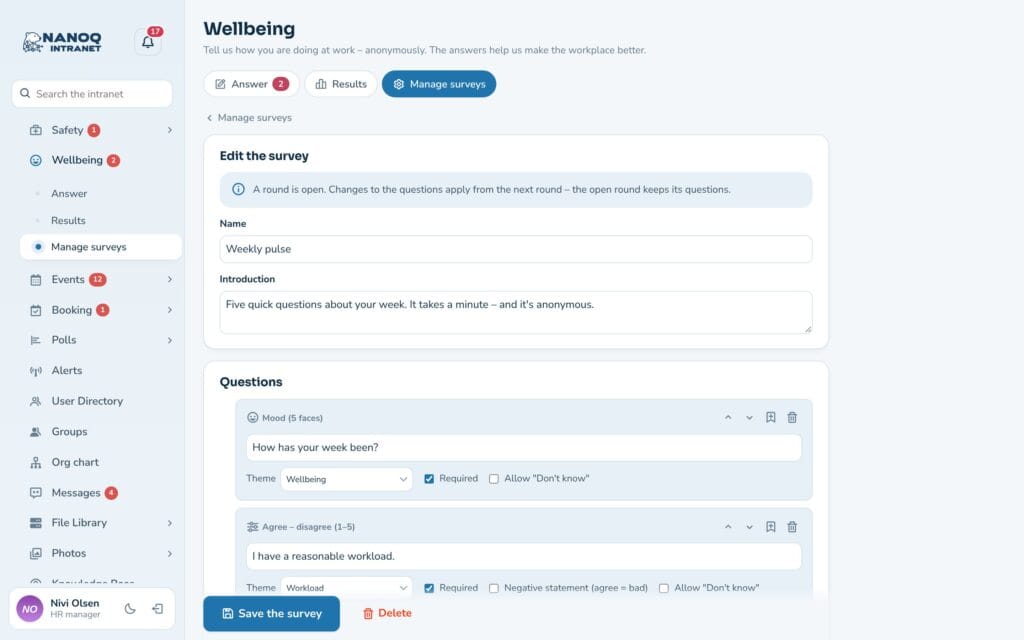
- Under Question: edit the texts, choose type and theme, and mark required questions and Negative statement (agree = bad). Use Add a question and the arrows to move them.
- Under Who and when: Who is asked (everyone or Only these groups), Repeats (once, every week, every other week, every month, every quarter or every year), First round starts, Open for (days) and Fewest answers before results are shown.
- Click Save the survey.
In the list you can Start now (open a round straight away), Close the round, see the results or edit the survey. Paused stops new rounds. If you delete a survey, all its results are deleted.
Rounds and reminders
A round is one period in which the survey is open. Repeating surveys open and close by themselves, and everyone in the target group gets a notification. The day before a round closes, those who haven’t answered get one reminder. The questions are stored with the round, so you can edit a survey without changing old results.
On the dashboard
The Wellbeing widget shows an open survey with the button “Answer the survey” – or “Answered – thank you” and the latest overall score you may see. Turn it on under Customize if you have already customised your dashboard.
For administrators
Under Nanoq → Wellbeing in wp-admin:
- Wellbeing survey – turn the module on.
- Who may build surveys – in addition to administrators and HR managers.
- Fewest answers before results are shown – the default for new surveys (at least 3, 5 recommended).
- Department leaders see their department – on by default.
- Share the result with everybody – everyone sees the whole workplace’s result when a round is closed (not departments and not comments).
- Roles without access – are not asked and cannot answer.
The shortcode [nanoq_survey] shows open surveys and the latest score on an ordinary page for logged-in users – see Shortcodes.
Good to know
- Keep the limit at 5 answers or more – in a very small department people could otherwise guess who answered what.
- “Don’t know” can be turned on for most questions (not eNPS). A follow-up question depends on one earlier question.
- The development applies to the chosen department or the whole workplace – it is not a comparison of departments over time.
- The answers are anonymous and remain when an employee is anonymised (GDPR); only the “has answered” mark is deleted.